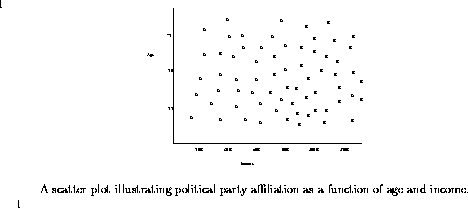
Suppose that you are given the job of distinguishing likely Democratic party voters from likely Republican voters on the basis of age and income. To give you the basis to make such a decision, you have polled 100 people and obtained their age, income, and party affiliation, and put the results in a scatterplot.
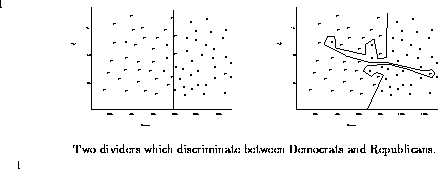
How can you generalize from this data to predict political affiliation, based only on people's age and income? The simplest approach would be to carve up the age-space plane into two regions, and assign each of these regions to one of the political parties. We present two possible divisions. On the left is the best possible Democrat-Republican discriminator which can be built from a single straight line. It cuts the space completely according to income - anyone who makes less than $80,000 a year is a classified a Democrat, while anyone who makes more than that is called a Republican.
Such a simple-minded division makes mistakes, of course. Indeed, 3 of the Democrats and 4 of the Republicans ended up on the wrong side of the line. On the right we provide a different divider that correctly classifies for all the compassionate rich and misguided poor in our test set, but it has to jump around a lot in order to do so.
Which of these two classifiers do you think does a better job distinguishing Democrats from Republicans? Even though it makes a few mistakes, I prefer the simpler model on the left. Its simplicity helps guard against overfitting the data, that is building a model which so completely reflects the weirdnesses of the training data that it misses the larger picture. The classifier on the right distorts its shape to correctly classify the outliers, while the classifier on the left mislabels these oddballs on the assumption that they are, in fact, oddballs without predictive value.
Properly modeling the expected trifecta payoffs required care to guard against overfitting our data. Recall that we averaged the results of all previous payoffs to predict future returns. This method worked well for most bet types, such as win, place, show, and quiniela. However, the results of simple averaging are not so easy to believe in the case of trifectas. There are 336 different trifecta combinations, so the average trifecta should have occurred roughly 23 times during our sampling interval. But this average is misleading because there is a high variance in the number of occurrences.
The mean or average is a statistical measure of the most likely
value of a sequence
while variance, and its close cousin standard deviation, measures
the consistency of values in a sequence.
Let us consider the annual salaries (in thousands of dollars)
of ten people in each of two different professions.
The first sample comes from unionized postal workers in Omaha, Nebraska:
The high variance of payoffs associated with rare trifectas becomes a problem in trying to accurately estimate their expected return. Suppose we were to pick a single random element of each of the two sets of salaries above. Which random salary would more accurately reflect the average of the group? There is less chance that a random element of the low-variance sequence will do a bad job representing his cronies than one from the more diverse sequence. Picking the manager as a typical representative of the telemarketing industry would be seriously misleading, but is just as likely as picking the single fellow who is right on the average.
Simply averaging the payoffs for rare, high-variance trifectas doesn't make much sense. Over the last two years the trifecta 8-7-6 came in only five times at Milford, paying at $3708.60, $4568.40, $4574.70, $1975.50, and $1293.00 for a $3 bet. What about even rarer trifectas which may have come in only once or never? What should they pay of at?
To do a better job estimating the payoff of rare trifectas, we partitioned them into groups with similar occurrence frequencies, and then averaged all the payoffs within each group. This meant all of the low probability trifectas in a given group were assigned the same expected payoff. Damping the projected payoff from the highest-return singleton payoff was essential to keep our betting system from being burned like a moth attracted to a flame. If one trifecta had a projected payoff of $2000 per dollar invested based on only one or two actual occurrences, the system would be liable to keep chasing what was probably a fluke payoff instead of a real quirk in the public's betting strategy.
|
I hope you have enjoyed this excerpt from
Calculated Bets: Computers, Gambling, and Mathematical Modeling to
Win!, by Steven Skiena,
copublished by
Cambridge University Press
and the
Mathematical Association of America.
This is a book about a gambling system that works. It tells the story of how the author used computer simulation and mathematical modeling techniques to predict the outcome of jai-alai matches and bet on them successfully -- increasing his initial stake by over 500% in one year! His method can work for anyone: at the end of the book he tells the best way to watch jai-alai, and how to bet on it. With humor and enthusiasm, Skiena details a life-long fascination with the computer prediction of sporting events. Along the way, he discusses other gambling systems, both successful and unsuccessful, for such games as lotto, roulette, blackjack, and the stock market. Indeed, he shows how his jai-alai system functions just like a miniature stock trading system. Do you want to learn about program trading systems, the future of Internet gambling, and the real reason brokerage houses don't offer mutual funds that invest at racetracks and frontons? How mathematical models are used in political polling? The difference between correlation and causation? If you are curious about gambling and mathematics, odds are this is the book for you! |